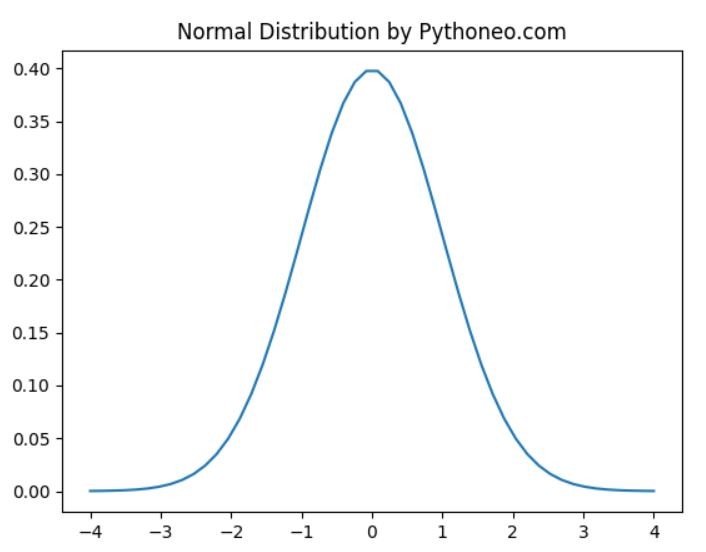
Creating a normal distribution plot is a common task in statistics and data analysis. See how to generate a normal distribution plot in Python using the simplest method.

Distribution plot implementation
To generate a normal distribution plot simply, we will import three essential Python libraries:
Here’s a simple implementation:
import numpy as np
from matplotlib import pyplot as plt
from scipy.stats import norm

normal_distribution_plot = np.linspace(-4, 4, 50)
plt.plot(normal_distribution_plot, norm.pdf(normal_distribution_plot, 0, 1))

plt.title("Normal Distribution by Pythoneo.com")
plt.show()
Numpy is used to generate an evenly spaced range of values. Matplotlib is utilized for plotting these values. Scipy’s norm.pdf function lets us generate the normal distribution curve.
That’s how thanks to just 3 functions we create normal distribution plot in Python.
