
Learn how to explode pie chart slices in Plotly using the pull parameter for interactive visualizations.
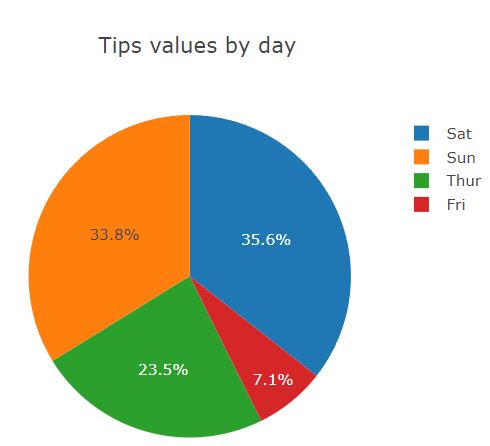
To see how to explode slice out I need example pie chart. I imported Plotly Express and use tips data which is defined in Plotly as example data set to work on.
This is a code of my example pie chart.
import plotly.express as px

data_frame = px.data.tips()
pie_chart = px.pie(data_frame,
             names='day',
             values='tip',
             title='Tips values by day',
             template='gridon')
pie_chart.show()
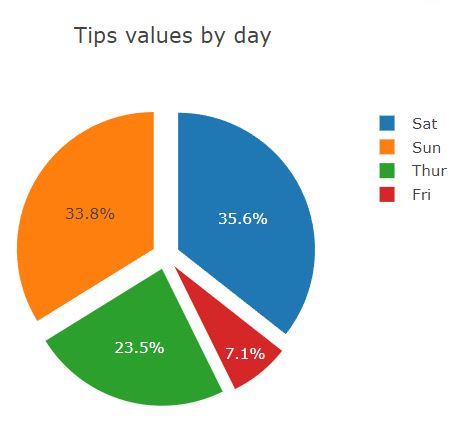
How to define pull
To explode out slices of my pie chart I need to update traces and define pull parameter. The higher the pull the more slices are exploded out from the pie chart.
pie_chart.update_traces(pull=0.1)
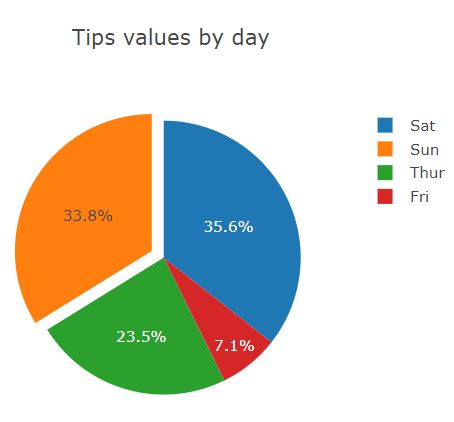
How to explode one slice of a pie
There is also a possibility to explode only one slice of a pie. To explode only one of them you need to create a list of pull parameter.
pie_chart.update_traces(pull=[0.1, 0, 0, 0])
And this is how one exploded out slice look like. Thanks to that I impored visibility of Sundays tips.