How to calculate the sum of columns and rows in the Numpy Python library? Let’s find out in the python tutorial below.
In Numpy, you can quickly sum columns and rows of your array.
How to Calculate Sum of Array Columns and Rows in Numpy
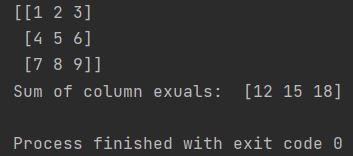
To calculate the sum of array columns, specify the axis parameter as 0.
import numpy as np

my_array = np.array([[1, 2, 3],
                    [4, 5, 6],
                    [7, 8, 9]])
print(my_array)
print("Sum of columns equals: ", np.sum(my_array, 0))
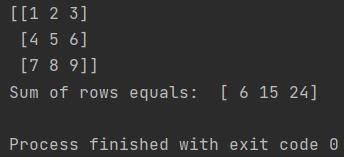
Similarly, to sum up rows, specify the axis parameter as 1.
import numpy as np

my_array = np.array([[1, 2, 3],
                    [4, 5, 6],
                    [7, 8, 9]])
print(my_array)
print("Sum of rows equals: ", np.sum(my_array, 1))
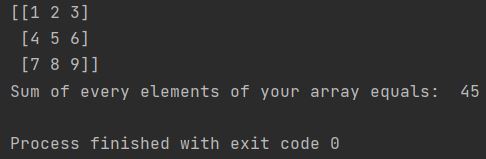
To sum up all elements in the array, omit the axis parameter.
import numpy as np

my_array = np.array([[1, 2, 3],
                    [4, 5, 6],
                    [7, 8, 9]])
print(my_array)
print("Sum of every elements of your array equals: ", np.sum(my_array))