Skip to content

Pythoneo

Online How to Python stuff

How to generate meshgrid in 3D with Numpy?

Posted on April 14, 2021May 17, 2022 By Luke K

Let’s learn a very interesting trick: how to generate meshgrid in 3D with Numpy.
my 3d meshgrid array

Generating three arrays

First I am generating 3 arrays:

import numpy as np

xs = np.linspace(0., 1., 2)
ys = np.linspace(1., 2., 2)
zs = np.linspace(3., 4., 2)

Obviously, they look like this:

import numpy as np

xs = np.linspace(0., 1., 2)
ys = np.linspace(1., 2., 2)
zs = np.linspace(3., 4., 2)

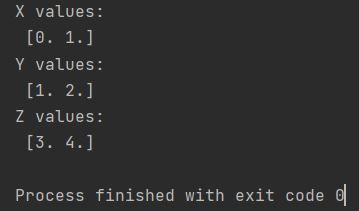
print(f"X values: \n {xs}")
print(f"Y values: \n {ys}")
print(f"Z values: \n {zs}")

Numpy meshgrid 3 arrays x y z

Generating 3D meshgrid arrays

To generate a 3D meshgrid array, I used the meshgrid function and provided the created arrays as parameters.

import numpy as np

xs = np.linspace(0., 1., 2)
ys = np.linspace(1., 2., 2)
zs = np.linspace(3., 4., 2)

meshgrid_array = np.meshgrid(xs, ys, zs)
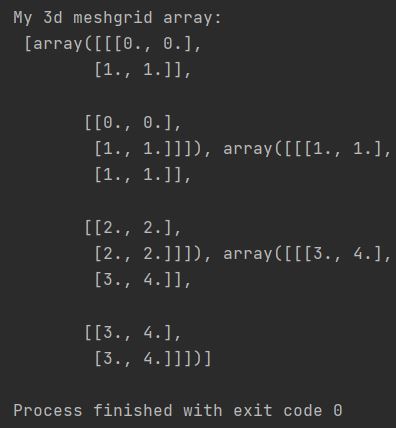
print(f"My 3d meshgrid array: \n {meshgrid_array}")

This is what a 3D meshgrid array looks like.

See also  How to concatenate arrays in Numpy?

my 3d meshgrid array

numpy Tags:array, dimension, grid, meshgrid

Post navigation

Previous Post: How to find index of max value in Numpy?
Next Post: How to generate random float in range with Numpy?

Categories

  • datetime (3)
  • Django (1)
  • glob (1)
  • io (1)
  • json (1)
  • math (4)
  • matplotlib (9)
  • numpy (83)
  • OpenCV (1)
  • os (3)
  • Pandas (2)
  • pathlib (2)
  • Pillow (3)
  • Plotly (1)
  • Python (24)
  • random (7)
  • requests (1)
  • Scipy (3)
  • Seaborn (3)
  • shutil (1)
  • sqlite3 (1)
  • statistics (16)
  • sys (1)
  • Tkinter (9)
  • turtle (2)
  • urllib (1)
  • webbrowser (1)

RSS RSS

  • How to Make a Countplot in Seaborn
  • AttributeError: partially initialized module ‘cv2’ has no attribute ‘img’ (most likely due to a circular import)
  • How to enumerate dictionary in Python?
  • How to compare two arrays in Numpy?
  • How to square a matrix in Numpy?
  • Exploding out slices of a Pie Chart in Plotly
  • How to uninstall Numpy?
  • How to create Seaborn Heatmap?
  • How to create a BarPlot in SeaBorn?
  • What is the use of assert in Python?

Tags

arithmetic mean array axis button calculations chart conversion copy count counter data type dictionary dimension draw error files fill float generate grid GUI image index integer list matrix max mean median min normal distribution plot random reshape rotate round size standard deviation string sum test text time variance zero

Copyright © 2022 Pythoneo.

Powered by PressBook WordPress theme

We use cookies on our website to give you the most relevant experience by remembering your preferences and repeat visits. By clicking “Accept”, you consent to the use of ALL the cookies.
Cookie settingsACCEPT
Manage consent

Privacy Overview

This website uses cookies to improve your experience while you navigate through the website. Out of these, the cookies that are categorized as necessary are stored on your browser as they are essential for the working of basic functionalities of the website. We also use third-party cookies that help us analyze and understand how you use this website. These cookies will be stored in your browser only with your consent. You also have the option to opt-out of these cookies. But opting out of some of these cookies may affect your browsing experience.
Necessary
Always Enabled
Necessary cookies are absolutely essential for the website to function properly. This category only includes cookies that ensures basic functionalities and security features of the website. These cookies do not store any personal information.
Non-necessary
Any cookies that may not be particularly necessary for the website to function and is used specifically to collect user personal data via analytics, ads, other embedded contents are termed as non-necessary cookies. It is mandatory to procure user consent prior to running these cookies on your website.
SAVE & ACCEPT