
Generating random samples from a normal distribution is a common task in various applications, including statistics and machine learning. Let’s learn how to generate random samples from a normal (Gaussian) distribution in Numpy Python library.
The normal distribution is a probability distribution in statistics. It is characterized by its bell shape and is described by two main parameters: the mean (μ) and the standard deviation (σ). The mean determines the center of the distribution, while the standard deviation controls its spread or width.
How to Generate Random Normal Distribution Samples Using NumPy’s np.random.normal() Function
Numpy random normal function does the job.
Parameters:
How to Generate Random Normal Distribution Samples with np.random.normal() in Python
Sample code:
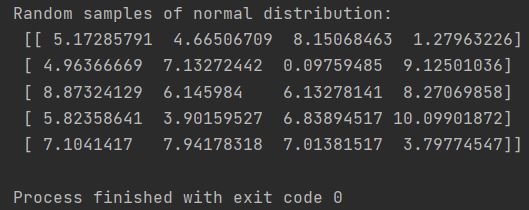
import numpy as np

my_array = np.random.normal(5, 3, size=(5, 4))

print(f"Random samples of normal distribution: \n {my_array}")
The np.random.normal(5, 3, size=(5, 4)) function generates a 5×4 NumPy array containing random samples from a normal distribution centered at 5 with standard deviation 3.
Histogram of the generated data
Visualizing these samples with histograms, as demonstrated, further enhances understanding of the generated distribution.
import numpy as np
import matplotlib.pyplot as plt

my_array = np.random.normal(5, 3, size=1000)

plt.hist(my_array, bins=30, density=True, alpha=0.6, color='g') # Histogram with density and aesthetics
plt.title('Histogram of Random Samples from Normal Distribution')
plt.xlabel('Sample Value')
plt.ylabel('Probability Density')
plt.grid(True)
plt.show()