I will explain how to use numpy mgrid, a powerful tool for creating multidimensional grids.
Numpy mgrid is a function that returns a dense multi-dimensional “meshgrid”. A meshgrid is an array that contains the coordinates of a rectangular grid.
How to create 2D grid
For example, if we want to create a 2D grid with x-coordinates ranging from 0 to 4 and y-coordinates ranging from 0 to 2, we can use numpy mgrid as follows:
import numpy as np
x, y = np.mgrid[0:5, 0:3]
print(x)
print(y)
The output will be:
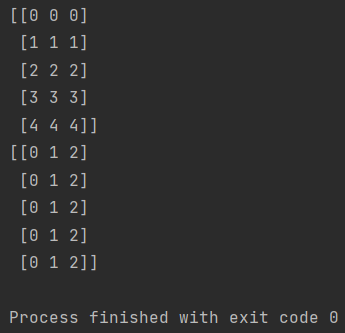
The first array x contains the x-coordinates of each point in the grid, and the second array y contains the y-coordinates. Notice that the shape of the arrays is (5, 3), which corresponds to the number of points along each dimension. The syntax of numpy mgrid is similar to slicing, where we specify the start, stop and optional step size for each dimension. By default, the step size is 1, but we can change it to create grids with different spacing.
How to create a grid with x-coordinates
For example, if we want to create a grid with x-coordinates from -5 to 5 with a step size of 0.5, and y-coordinates from -3 to 3 with a step size of 0.25, we can use:
x, y = np.mgrid[-5:5.5:0.5, -3:3.25:0.25]
Numpy mgrid can also create grids in higher dimensions, such as 3D or more. For example, if we want to create a 3D grid with x-coordinates from -1 to 1, y-coordinates from -2 to 2, and z-coordinates from -3 to 3, we can use:
x, y, z = np.mgrid[-1:2, -2:3, -3:4]
The shape of the output arrays will be (3, 5, 7), which is the number of points along each dimension.
Numpy mgrid is useful for many applications that require working with grids, such as plotting functions, interpolating data, solving partial differential equations, etc.
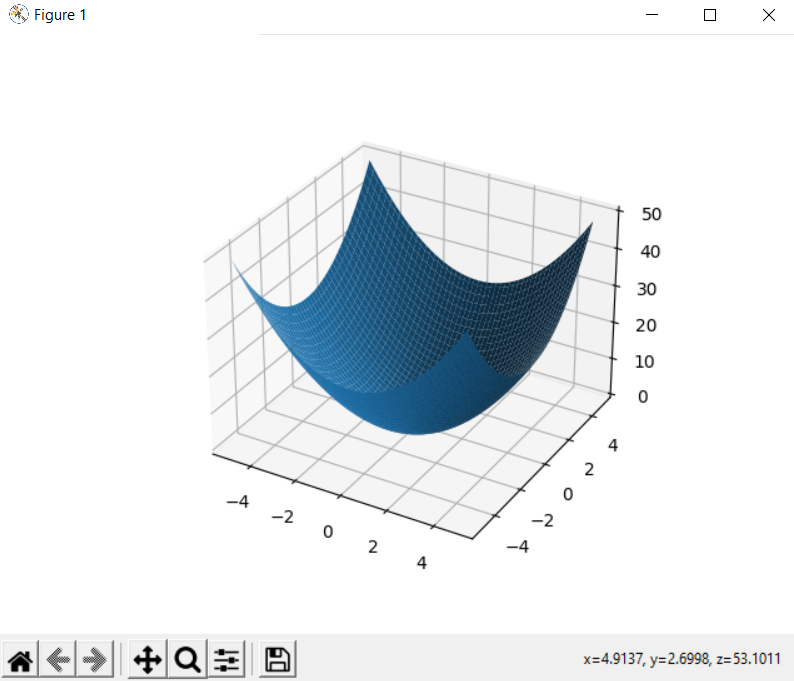
How to plot a defined surface
For example, if we want to plot a surface defined by z = x**2 + y**2, we can use numpy mgrid to create the grid of x and y values, and then use matplotlib to plot the surface:
import numpy as np
import matplotlib.pyplot as plt
from mpl_toolkits.mplot3d import Axes3D

x, y = np.mgrid[-5:5:0.1, -5:5:0.1]
z = x**2 + y**2

fig = plt.figure()
ax = fig.add_subplot(111, projection='3d')
ax.plot_surface(x, y, z)
plt.show()