
A countplot is a bar chart that shows the number of observations for each category of a categorical variable. It is a simple and effective way to visualize the distribution of a categorical variable.
How to Create a Countplot in Seaborn
To create a countplot in Seaborn, call sns.countplot() with your categorical column and DataFrame, for example sns.countplot(x=’passengers’, data=df) on the built‑in taxis dataset. The syntax is as follows:
sns.countplot(x=column_name, data=dataframe)
where column_name is the name of the categorical variable that you want to plot, and dataframe is the name of the dataframe that contains the data.
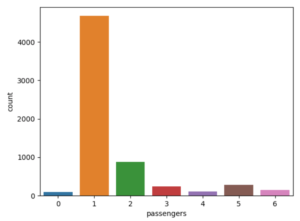
For example, the following code creates a countplot of the passengers column in the taxis dataset:
import seaborn as sns
import matplotlib.pyplot as plt

df = sns.load_dataset('taxis')

sns.countplot(x='passengers', data=df)
plt.show()
This code will create a bar chart that shows the number of taxis with each number of passengers.
Seaborn’s sns.countplot() supports powerful customization via parameters like hue, order, hue_order, palette, color, dodge, and saturation, letting you style and sort your categorical distribution plot precisely.
Countplot rotation
To flip the chart, just change the x argument to y.
sns.countplot(y='passengers', data=df)
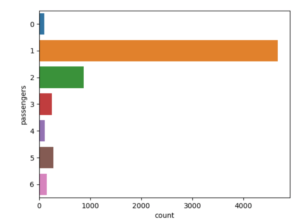
You can also use a orient parameter and set v for a vertical alignment or h for a horizontal one.
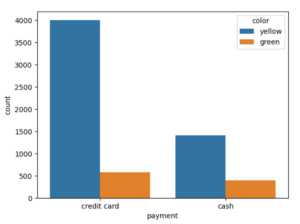
Countplot hue
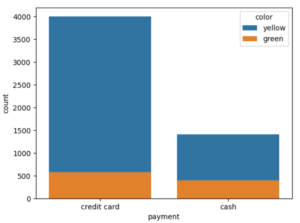
To increase the amount of data in the chart you may use the hue parameter. It is adding an additional sets of data to your counterplot graph. I decided to visualize payments with color of the taxi to check the relationship between them.
sns.countplot(x='payment', data=df, hue='color')
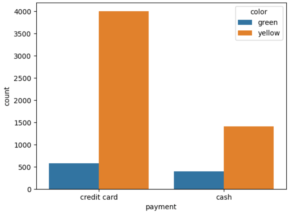
Countplot hue_order
The hue_order parameter gives you the possibility of changing the order of a hue. I used simply df[‘color’].value_counts().index[::-1] structure to change the order by index in the reverse order.
sns.countplot(x='payment', data=df, hue='color',
              hue_order = df['color'].value_counts().index[::-1])
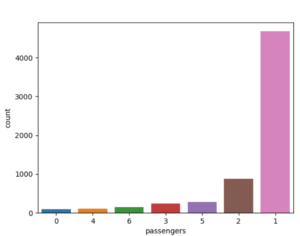
Countplot order
To sort the data series use the order parameter. I picked df[‘passengers’].value_counts().index to sort counts.
sns.countplot(x='passengers', data=df,
              order=df['passengers'].value_counts().index)

Countplot ascending order
To sort the data series in ascending order, add the reverse indexing using index[::-1].
sns.countplot(x='passengers', data=df,
              order=df['passengers'].value_counts().index[::-1])
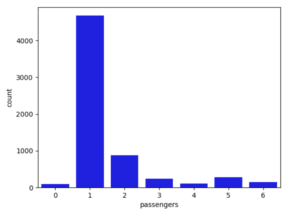
Countplot color
It is also possible to change the color of your python countplot. I set the color parameter to blue.
sns.countplot(x='passengers', data=df, color='blue')
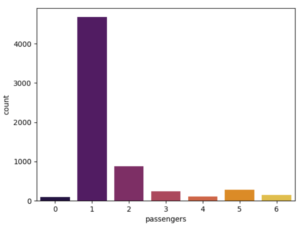
Countplot palette
If one color is not enough for you or you want to make your chart look more attractive, use the palette parameter. I dediced to use the inferno.
sns.countplot(x='passengers', data=df, palette='inferno')
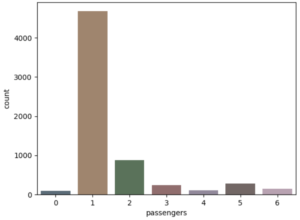
Countplot saturation
For those who care about details, you can also change the color saturation. The default is 0.75. Watch the saturation change as you lower it to 0.2.
sns.countplot(x='passengers', data=df, saturation=0.2)
Countplot dodge
To stack data in a countplot, use a dodge. By default, dodge is set to true. If you change this parameter to false, the count graph will change like this. The data has been accumulated.
sns.countplot(x='payment', data=df, hue='color', dodge=False)
These are all the parameters of the countplot method that I wanted to discuss for you. I hope you will improve your charting skills at Seaborn with this python course.
For more information on the countplot function, you can refer to the Seaborn documentation.