
Learn how to perform a Chi-Squared test in Python using SciPy to analyze categorical data distributions and test statistical hypotheses with code examples.
How to Perform Chi-Squared Tests in Python Using SciPy’s chisquare Function
Use SciPy’s built-in chisquare() function to conduct Chi-Squared tests on observed frequencies, calculating test statistics and p-values for categorical data analysis.
The chisquare() function returns a test statistic and p-value. Compare the p-value against a 0.05 significance level to determine if observed deviations from expected frequencies are statistically significant.
from scipy import stats
numbers = [45, 67, 33, 54, 33]
chi = stats.chisquare(numbers)
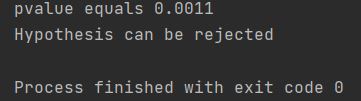
print(f"pvalue equals {round(chi.pvalue, 4)}")
if chi.pvalue < 0.05:
print("Hypothesis can be rejected")
else:
print("Hypothesis is valid")
We compare the p-value against a significance level of 0.05. If the p-value is less than 0.05, the null hypothesis can be rejected, meaning the deviations are statistically significant.
This indicates that the deviations between the observed frequencies are statistically significant, allowing us to reject the null hypothesis.
Chi-Squared testing helps determine whether variations in categorical data result from random chance or represent statistically significant relationships in your data distribution.