
This guide shows how to calculate geometric mean in Python using the statistics module, NumPy logarithmic method, or SciPy’s gmean function for data analysis tasks. The geometric mean is a measure of central tendency that is useful for dealing with data that has a wide range of values and is often used in finance, biology, and other fields.
Calculating a geometric mean with the statistics module
To calculate the geometric average, we need to import the statistics module.
Python’s statistics.geometric_mean() provides the simplest way to calculate geometric mean in Python from any list of positive numbers, handling the root-of-product formula automatically.
import statistics as s

x = [1, 5, 7, 8, 43, 6]

geometric_mean = s.geometric_mean(x)
print("Geometric mean equals: " + str(round(geometric_mean, 2)))
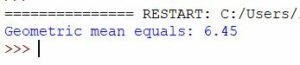
The statistics.geometric_mean function computes the geometric mean of the values in the list x. In this example, the geometric mean is rounded to two decimal places:
Calculating a geometric mean using numpy
For calculating the geometric mean using the NumPy library, follow this approach:
import statistics as s
import numpy as np

x = [1, 5, 7, 8, 43, 6]

geometric_mean = np.exp(np.mean(np.log(x)))
print("Geometric mean equals: " + str(round(geometric_mean, 2)))
In this approach, we first compute the natural logarithm of the data points, calculate their mean, and then exponentiate the result to obtain the geometric mean.
The output is as follows:
Geometric mean equals: 6.45
Calculating a geometric mean using scipy
Alternatively, you can use scipy to calculate a geometric mean.
from scipy.stats import gmean

x = [1, 5, 7, 8, 43, 6]

geometric_mean = gmean(x)
print("Geometric mean equals: " + str(round(geometric_mean, 2)))
As you can see, gmean is the function that you can use to calculate the scipy geometric mean.