
Let’s use Python Tkinter canvas to draw a hyperbola step by step, so you can learn basic GUI plotting in Python.
How to draw a hyperbola?
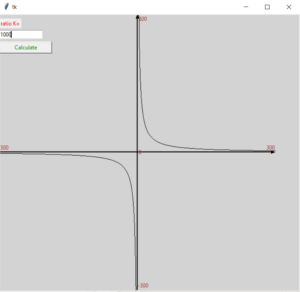
A hyperbola is a type of curve with two branches and asymptotes. To draw a hyperbola in tkinter, you need to use the create_line method of the Canvas widget. You can use a loop to generate the coordinates of the points on the hyperbola, and then connect them with lines. Here is an example of how to draw a hyperbola:
from tkinter import *
root=Tk()
c = Canvas(root, width = 650, height = 600, bg = "light grey")
c.create_line(300,600,300,0,width=2,arrow=LAST) #axis y
c.create_line(0,300,600,300,width=2,arrow=LAST) #axis x

c.create_text(312,10,text='300',fill='brown')
c.create_text(312,590,text='-300',fill='brown')
c.create_text(306,300,text='0',fill='brown')
c.create_text(8,290,text='-300',fill='brown')
c.create_text(590,290,text='300',fill='brown')

label_k=Label(root,text="ratio K=",fg='red')
label_k.place(x=0,y=10)

entry_k=Entry(root,width=15,bg='white')
entry_k.place(x=0,y=35)

def gip(k):
    xy1 = []
    xy2 = []
    for i in range( 300 ):
        x = i - 300
        y = int( k / x )
        xy1.append( 300 - x )
        xy1.append( 300 + y )
        xy2.append( 300 + x )
        xy2.append( 300 - y )

    c.create_line( xy1, fill='black' )
    c.create_line( xy2, fill='black' )

btn_calc=Button(root,text='Calculate',width=15,fg='green')
btn_calc.bind('',lambda event: gip(float(entry_k.get())))
btn_calc.place(x=0,y=60)
c.pack()
root.mainloop()
You can easily modify the Python Tkinter hyperbola drawing code to change parameters like the ratio K, canvas size, and hyperbola orientation for different math visualizations.
How to draw a hyperbola with asymptotes in tkinter?
In addition to drawing a hyperbola, you can also draw its asymptotes in tkinter. To do this, you can use the create_line method of the Canvas widget to draw two lines that are parallel to the axes of the hyperbola. The asymptotes will never intersect the hyperbola, but they will get closer and closer to it as the distance from the origin increases.
The only difference is that we add two lines to the code that draw the asymptotes.