
Calculating percentiles in Python using NumPy is simple and efficient. Let’s explore how to use the percentile function in the NumPy library.
Percentiles are statistical measures for understanding the distribution and spread of data. They divide a dataset into 100 equal parts, providing insights into the relative standing of individual values within the dataset. For example, the 90th percentile represents the value below which 90% of the data points fall, indicating that only 10% of the data exceeds this value.
How to Calculate Percentile in Numpy
NumPy provides the percentile function, which allows you to calculate percentiles from a given dataset. A percentile is a measure used in statistics indicating the value below which a given percentage of observations fall.
Here’s how to calculate percentiles using NumPy:
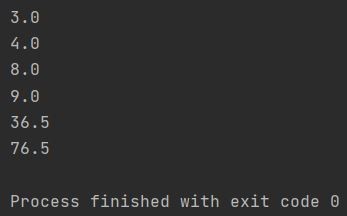
import numpy as np

a = (1, 5, 7, 11, 87, 45)

print(f"{np.percentile(a, 10)}")
print(f"{np.percentile(a, 45)}")
print(f"{np.percentile(a, 50)}")
print(f"{np.percentile(a, 75)}")
print(f"{np.percentile(a, 95)}")
The percentile function takes two main arguments:
Data Array: The dataset from which you want to calculate the percentile (in this case, a).
Percentile: The desired percentile (e.g., 10, 45, 50, 75, 95).
In this example, the function calculates various percentiles for the dataset a. The 50th percentile, for instance, represents the median of the dataset.
The numpy.percentile function offers several optional parameters to customize percentile calculation. For instance, the axis parameter enables you to calculate percentiles along a specific axis in a multi-dimensional array. The interpolation parameter allows you to control how percentiles are estimated when the desired percentile falls between two data points; different interpolation methods such as linear, lower, higher, midpoint, and nearest are available to handle such cases.
Check also how to calculate percentile in Excel.