I will explain how to use numpy logspace, a handy function for creating logarithmically spaced arrays. Such arrays are particularly useful in various scientific and engineering applications where data or phenomena span several orders of magnitude. For example, in frequency analysis, signal processing, or when dealing with exponential scales, logarithmic spacing is often more appropriate than linear spacing to represent data effectively and explore a wide range of values.
Numpy logspace is a function that returns an array of numbers that are evenly spaced on a log scale. The syntax of the function is:
numpy.logspace(start, stop, num=50, endpoint=True, base=10.0, dtype=None, axis=0)
The parameters are:
– start: the starting value of the sequence, in log scale
– stop: the final value of the sequence, in log scale
– num: the number of samples to generate, default is 50
– endpoint: whether to include the stop value in the output, default is True
– base: the base of the log scale, default is 10
– dtype: the data type of the output array, default is None
– axis: the axis along which to generate the samples, default is 0
For example, if we want to create an array of 10 numbers between 10^1 and 10^3 on a log scale, we can use:
import numpy as np
arr = np.logspace(1, 3, num=10)
print(arr)
In the preceding example, np.logspace(1, 3, num=10) generates 10 numbers logarithmically spaced between 101 (which is 10) and 103 (which is 1000). The first element will be 101, and the last element will be 103, if endpoint=True (which is the default). The intermediate values are calculated to maintain even spacing on the logarithmic scale.
The output will be:

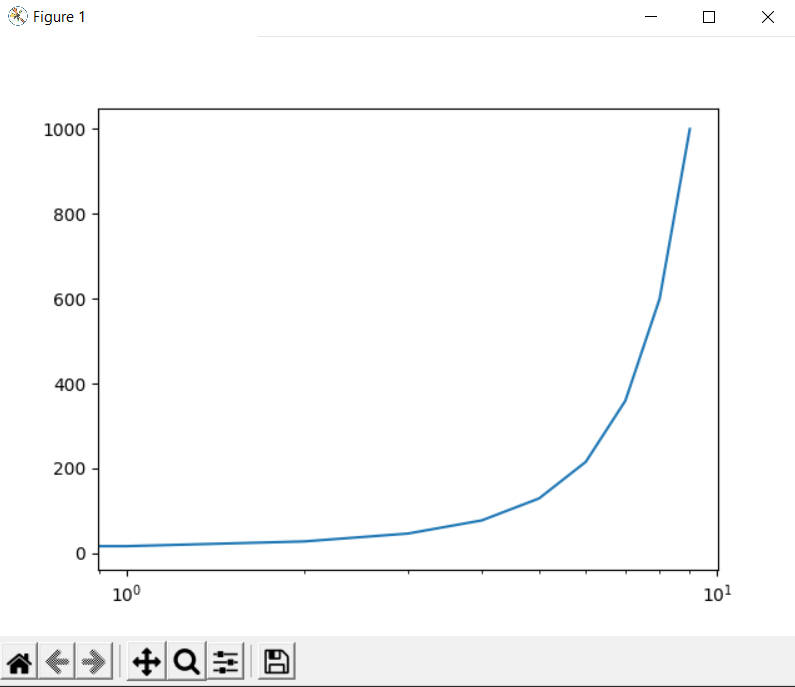
We can see that the numbers are not evenly spaced in linear scale, but they are in log scale:
import numpy as np
import matplotlib.pyplot as plt
arr = np.logspace(1, 3, num=10)

plt.semilogx(arr)
plt.show()

To exclude the stop value from the generated array, you can set the endpoint parameter to False. This can be useful in situations where you need to avoid including the exact upper bound of your range. For example, np.logspace(1, 3, num=10, endpoint=False) will generate 10 logarithmically spaced numbers starting from 101 but ending just before reaching 103.
